Monthly Demand
Bike Demand, by Hour of the Day & Day of the Month
This page explores bike usage patterns between two separate months, revealing differences and trends in user behavior dependent upon time.
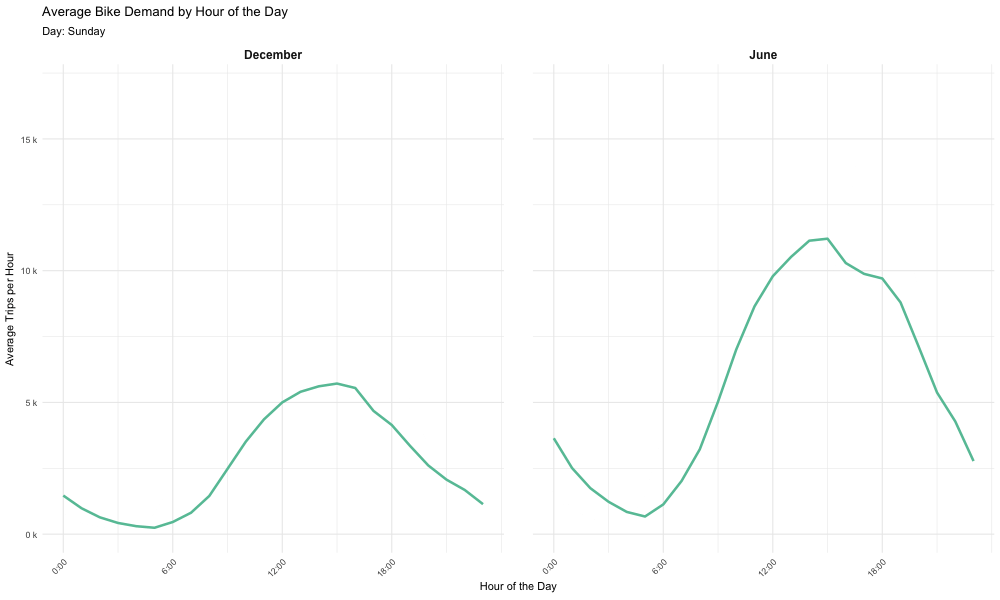
Demand by Hour of the Day
This graph compares the number of bike trips on the average day in June and December, showing how December usage is quite a bit lower on all fronts (likely due to the colder weather). They both align with the peaks of commuting hours.
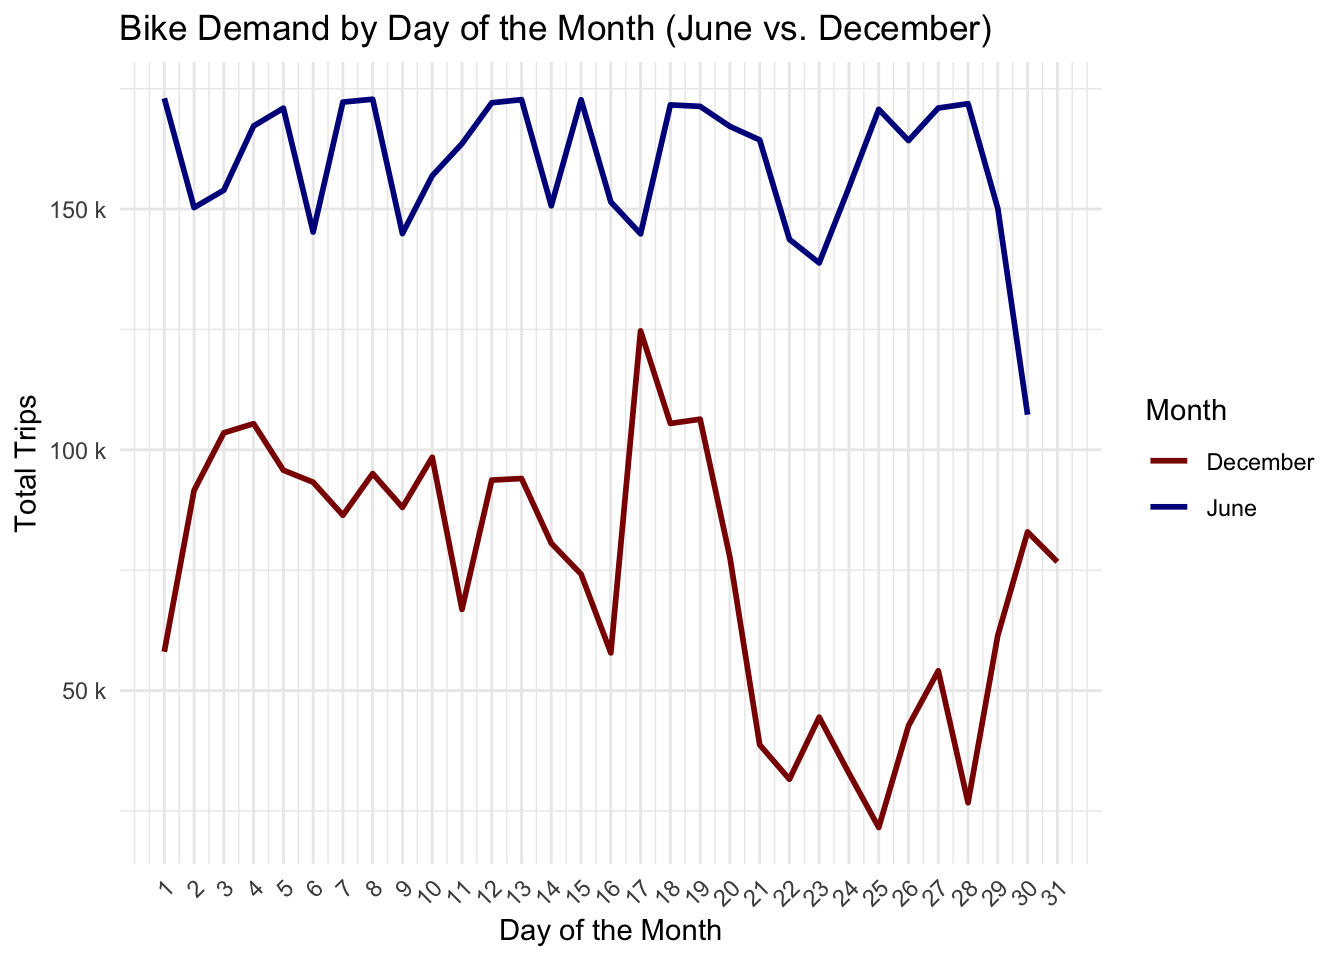
Demand by Day of the Month
This graph compares the amount of bike demand by day of the month, where we can observe a couple of behaviors, such as the weekly downturn visible more in June’s plotting, likely due to weekday commuters not using the bikes over the weekend, as well as lowest usage being observed during the holiday time in December.